su
dnf install gtkwave
It pulls in several other packages:
Installing:
 gtkwave                 x86_64  3.3.121-1.fc41
Installing dependencies:
 Judy                    x86_64  1.0.5-37.fc41
 amtk                    x86_64  5.6.1-7.fc41
 libgedit-gtksourceview  x86_64  299.0.5-2.fc41
 libpeas1-loader-python3 x86_64  1.36.0-7.fc41
 tepl                    x86_64  6.8.0-3.fc41
Installing weak dependencies:
 gedit                   x86_64  2:46.2-5.fc41
This takes only 2 minutes and it seems to "just work".

initial
begin
   $dumpfile("test.vcd");
   $dumpvars(0,test);
end
Then run your simulation via:
vvp foo.vvp -fstThe -fst option is not necessary, but is said to be faster than the default -vcd. I don't use it, but there it is for the record. What I do is the add the verilog lines as shown, then:gtkwave dump.fst
iverilog -o wave  counter2_tb.v counter2.v
vvp wave
gtkwave test.vcd
When I ran it, it produced "test.vcd" (none of this fst business for me) and I see the word "test" in the upper left pane. Now what? We roll up our sleeves and begin reading that 159 page manual. My notes follow.
VCD stands for "value change dump" (I wonder what vvp stands for). VCD is an industry standard (IEEE-1364). For now we ignore other formats, though we are aware that they exist and that they may offer higher performance.
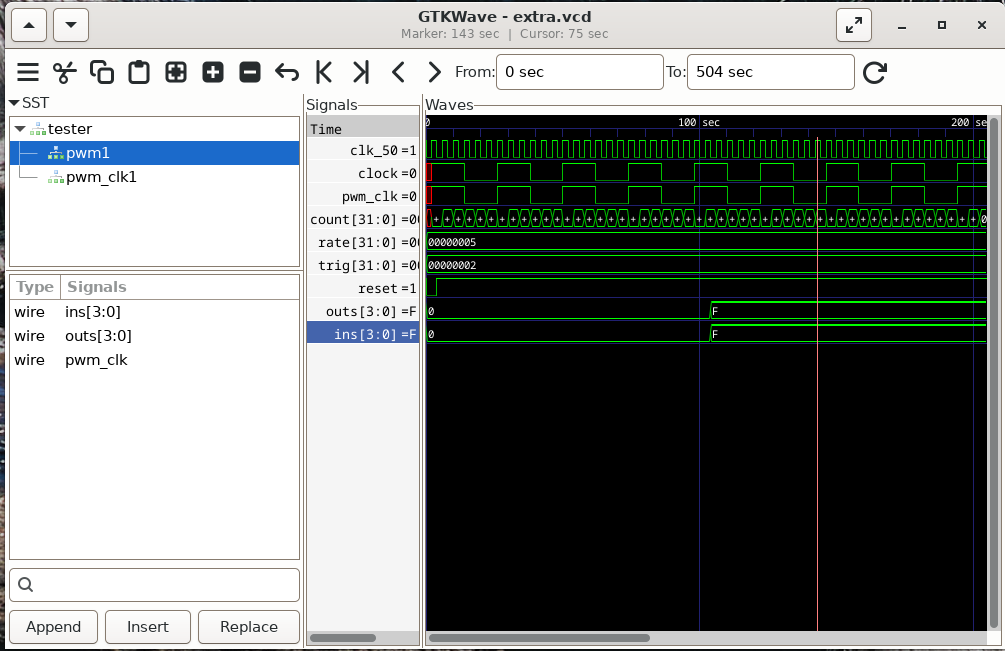
When I run it I see SST on the left (signal search tree). A narrow vertical band to the right of that is labeled "signals", and to the right of that is a big black pane marked "waves". Our mission is to get some of our signal displayed in the "waves" area.
The game starts with the word "test" in the SST subwindow. This is the name of the top level module in my test bench.
I click on "test" and some signal names appear in the subwindow below.
I expand "test" and out pops "c1". This is the instantiated name of the one
and only module in this particular demo. If I had more modules, they would also
pop out. When I click on "c1" I get signals for it in the subwindow below.
In other words "c1" corresponds to this:
counter c1 (value, clk, reset);
I can select a signal by clicking on it, then clicking the "Append" button below. This causes it to be added to the "Signals" strip and to the "Waves" display. You can keep selecting and appending signals to get all that you want. Alternately, you can just drag and drop signals to the "Signals" strip.
I see at the top that I have time from 0 to 575 seconds available, but only the first 2 seconds are getting displayed. Using the "-" button causes the display to zoom out showing me more time. We have +, -, "zoom fit" as well as buttons to go to the start or end. There are no buttons to move left or right, but there is a scroll bar at the bottom of the waves subwindow for that!
The buttons that look like left and right are actually find previous edge and find next edge. Arrow keys don't work, nor does the mouse.
gtkwave test.vcd easy.gtkw
In the "guide" line above he talks about a "translate filter file" that you can set up to translate numerical values to register names, opcodes to full instructions and amazing things that would be handy for a complex design like a microcontroller. He is my hero because he talks about using a Makefile to work with iVerilog, somewhat like I do. He works up a MIPS assembler simulator, which is far beyond anything I need at this time, but it is good to know that such things can be done.
Tom's Computer Info / tom@mmto.org